Chartkick and turbo frames - elevating rails visuals
In today’s digital landscape, delivering dynamic and interactive content is essential for engaging user experiences. Rails developers often leverage powerful tools like Chartkick to visualize data seamlessly within their applications.
Concurrently, Turbo Frames offer a streamlined way to update parts of a webpage without a full reload, enhancing responsiveness and user experience. In this blog post, we’ll explore the synergy between Chartkick charts and Turbo Frames in Rails applications, empowering developers to create rich, real-time data visualizations within a fluid user interface.
Make a dashboard
To begin implementing our dashboard with its accompanying charts, we first need to create a controller to manage these features.
$ rails g controller MyDashboardController
This command generates a new controller named MyDashboardController, which will handle the logic for rendering the dashboard and fetching data for the charts.
Inside our MyDashboardController, we define three actions:
class MyDashboardController < ApplicationController
  def index
    # Action to render the main dashboard view
  end

  def users_chart
    # Action to fetch data for the users chart
  end

  def orders_chart
    # Action to fetch data for the orders chart
  end
end
Here’s a breakdown of each action:
index: this action is responsible for rendering the main dashboard view. It serves as the entry point for users accessing the dashboard interface.users_chartandorders_chart: these actions serve as endpoints to fetch data for the respective charts displayed on the dashboard. They will handle any necessary data processing and formatting required for visualization.
Now that we have our controller set up, we need to define routes to access these actions:
# config/routes.rb

get 'my_dashboard', to: 'my_dashboard#index'
get 'my_dashboard/users', to: 'my_dashboard#users_chart'
get 'my_dashboard/orders', to: 'my_dashboard#orders_chart'
These route definitions map specific URLs to the corresponding actions in the MyDashboardController.
Users can access the dashboard and retrieve data for the charts by navigating to these URLs.
The index action renders the main dashboard view, while the users_chart and orders_chart actions fetch data for the respective charts.
With our controller and routes in place, we’re now ready to build out the dashboard interface and integrate the charts seamlessly.
Add turbo frames
After implementing the index view, we can finally start visualizing our dashboard.
Let’s take a look at the initial structure of our dashboard page:
<!-- app/views/my_dashboard/index.html.erb -->

<div>
  <div id='header' class='flex'>
    <span class='bg-white p-3 w-full rounded text-center uppercase text-lg font-bold'>
      My Dashboard
    </span>
  </div>

  <div id='charts' class='flex flex-col justify-between mt-2 gap-2'>
  </div>
</div>
In this snippet, we’ve created a simple layout with two sections: a header and a container for charts. To expedite styling, we’ve utilized Tailwind CSS.
As the next step, we’ll integrate Turbo Frames to load our charts simultaneously. Turbo Frames provide a seamless way to fetch and display content without full page reloads. Let’s add Turbo Frames for each chart:
  <div class='flex flex-col justify-between mt-2 gap-2'>
+    <% %i[users_chart orders_chart].each do |action| %>
+      <%= turbo_frame_tag action, src: url_for(action: action), loading: :lazy, class: 'w-full'  %>
+    <% end %>
  </div>
In this code snippet, we iterate through an array containing the actions (users_chart and orders_chart) for our charts.
For each action, we create a Turbo Frame with a unique identifier (action) and specify the endpoint using url_for(action: action).
Additionally, we include the loading: :lazy parameter to enable lazy-loading, ensuring that the frames are fetched lazily.
Elevate the visual with a chartkick
To visualize the data with Chartkick, we first need to retrieve it from the database using ActiveRecord and then pass it to our views.
Let’s walk through the implementation of the users_chart action in our controller:
class MyDashboardController < ApplicationController
+ FRAME_CHART_PARTIAL = 'my_dashboard/frame_chart'
def users_chart
+ data = User.group_by_day(:created_at).count
+ opts = {
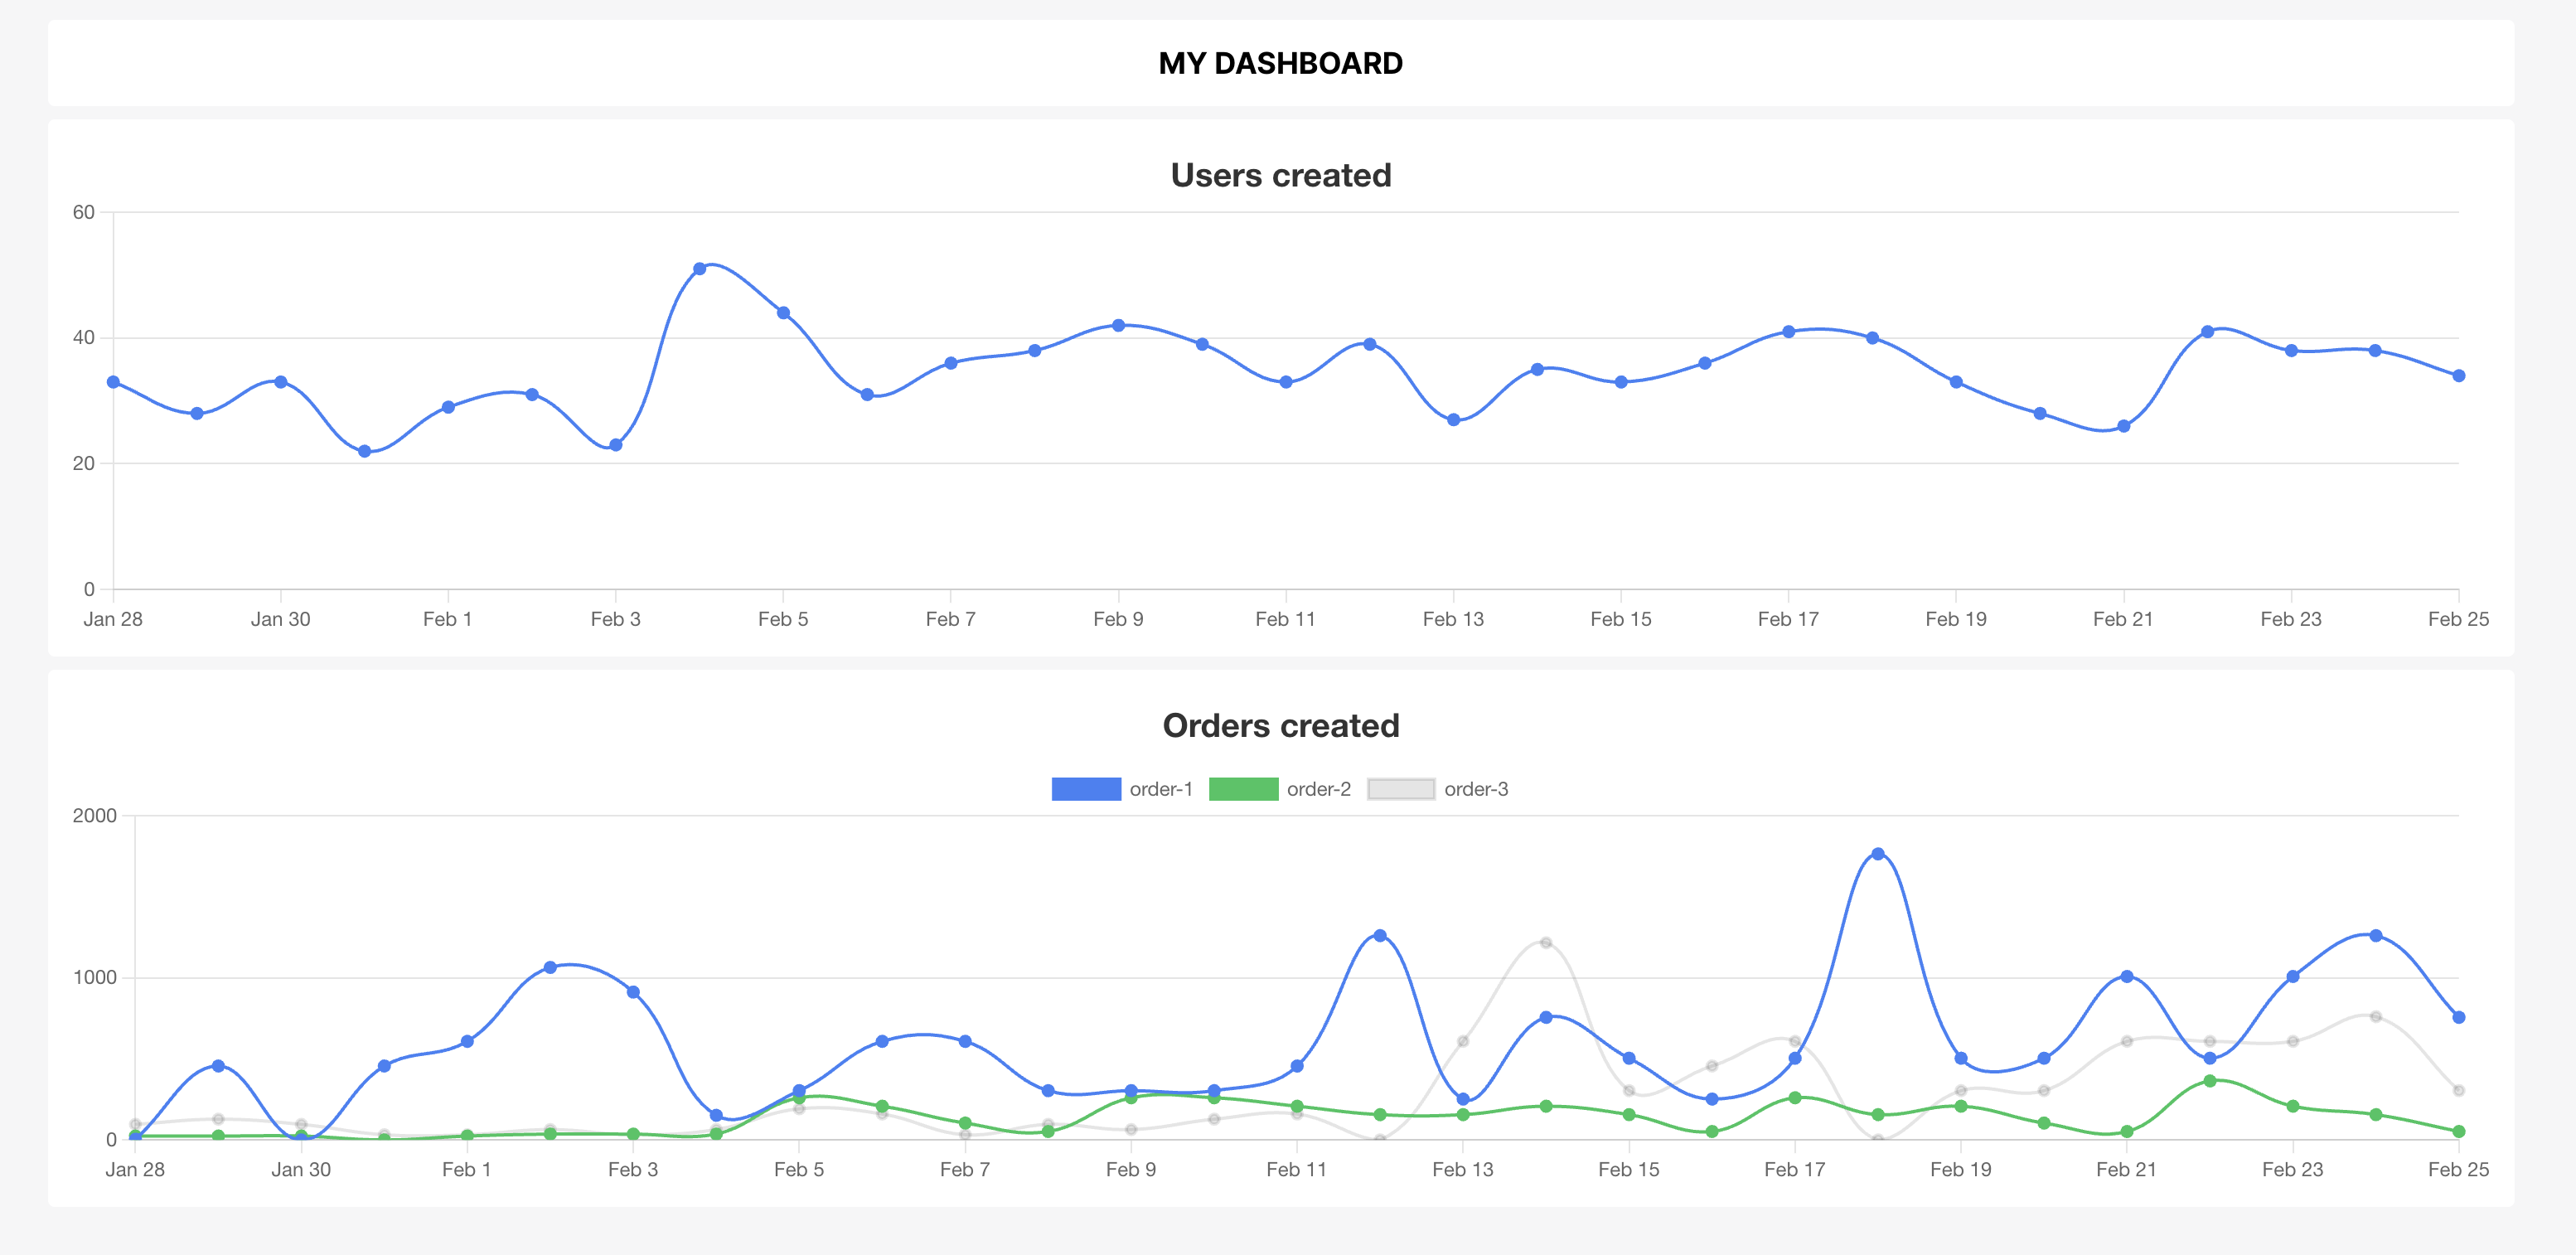
+ title: 'Users created',
+ colors: %w(#3b82f6)
+ }
+
+ render partial: FRAME_CHART_PARTIAL,
+ locals: { id: :users_chart, data: data, opts: opts }
end
end
In the users_chart action, we group users by the created_at field and count the number of users created on each day.
Then we defined the options for our chartkick helpers and render the partial that will use the defined variables.
Note: the group_by_day method is just a high level DSL defined by groupdate gem.
Next we can add a second action orders_chart:
class MyDashboardController < ApplicationController
+  def orders_chart
+    data = Order.group(:order_type).group_by_day(:created_at).sum(:quantity)
+    opts = {
+      title: 'Orders created',
+      colors: %w(#3b82f6 #22c55e)
+    }
+
+    render partial: FRAME_CHART_PARTIAL,
+           locals: { id: :orders_chart, data: data, opts: opts }
+  end
end
Similarly, in the orders_chart action, we group orders by both order_type and created_at, summing the quantity of orders for each day and type.
Finally, we can define the partial view that will utilize the provided data and visualize it:
<!-- app/views/my_dashboard/_frame.html.erb -->

<%= turbo_frame_tag(id) do %>
  <div class="bg-white p-3 rounded">
    <%= line_chart data, id: "#{id}-chart", **opts %>
  </div>
<% end %>
In this partial, we use turbo_frame_tag to wrap our chart and ensure it correctly replaces the designated area in the index template.
Within the frame, we utilize the line_chart helper provided by Chartkick to render the chart based on the provided data and options.
Wrap-up
In this blog post, we’ve successfully implemented dynamic charts in our Rails application’s dashboard using Chartkick and Turbo Frames. By fetching and visualizing data with ActiveRecord and Chartkick helpers, and seamlessly integrating them into the interface with Turbo Frames.